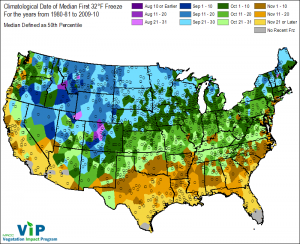
Frost Date Maps
These Frost Date Maps Derived from the 1981–2010 U.S. Climate Normals—30-year averages of climatological variables like temperatures—these maps show the time of year, on average, that areas across the nation can expect to see their temperatures dip to 32°F or below for the last time. The map reveals some interesting regional differences across the country. In the East, the last spring freeze date generally progresses through time as you move northward on the map. However, in the West, the changes are much more complex due to elevation and coastal influences.
Wondering what happened to Alaska, Hawaii, and Puerto Rico? The unique climates of these regions pose a problem in calculating the average date of the last spring freeze. Nearly all of Alaska falls into the “too cold to compute” category, meaning that the state is likely to see freezing temperatures year-round. At the opposite end of the spectrum, all of Puerto Rico and all but the highest elevations of the state of Hawaii fall into the “too warm to compute” category, meaning that they very rarely or never see freezing temperatures.
For more information – go to National weather Service
Back to Garden Blog